This post describes step-by-step guide to do basic debugging of CC2538DK Demo of Contiki 2.7 on Windows. The basic idea is derived from an official AN128 application note from TI, however it uses Code::Blocks as IDE instead of Eclipse IDE running on Windows 7.
Setting Up The IDE
Just as described in my previous post, I am using Code::Blocks as the IDE. Download and install Code::Blocks from this link, and also the GNU ARM compiler from this link. Download also the Code::Blocks project file from my google drive, and put the cc2538dk-demo.cbp file into Contiki 2.7 folder under contiki-2.7\examples\cc2538dk, and open it with the installed IDE
Modifying Contiki Source Code
From my observation, there are a couple things to be modified in the Contiki source files to be able to do the debugging properly.
First of all, I observed that proper debugging requires the watchdog to be turned off. Therefore disable/comment out watchdog_start() call in platform\cc2538dk\contiki-main.c as shown as follows
int
main(void)
{
  ...........
  autostart_start(autostart_processes);

  //watchdog_start();
  fade(LEDS_ORANGE);

  while(1) {
    ...........
  }
}
The basic compilation setting for the Contiki 2.7 CC2538DK demo doesn’t include the option to generate the debugging information (standard is DWARF version 2), and by default it also uses a higher optimization level which might not be suitable for debugging (some variables and functions can be optimized out by the compiler). Therefore modify cpu\cc2538\Makefile.cc2538 file to change the optimization level (-O2 to -O0) and add -gdwarf-2 as compilation flag.
CFLAGS += -O0 -mcpu=cortex-m3 -mthumb -mlittle-endian
CFLAGS += -fshort-enums -fomit-frame-pointer -fno-strict-aliasing
CFLAGS += -Wall
CFLAGS += -gdwarf-2
LDFLAGS += -mcpu=cortex-m3 -mthumb -nostartfiles
LDFLAGS += -T $(LDSCRIPT)
LDFLAGS += -Wl,-Map=$(@:.elf=-$(TARGET).map),--cref,--no-warn-mismatch
OBJCOPY_FLAGS += -O binary --gap-fill 0xff
Compiling and Flash The Binary
After modifying the source codes, the code can now be compiled by going “Build” -> “Rebuild”. The compilation shall succeeds without any errors.
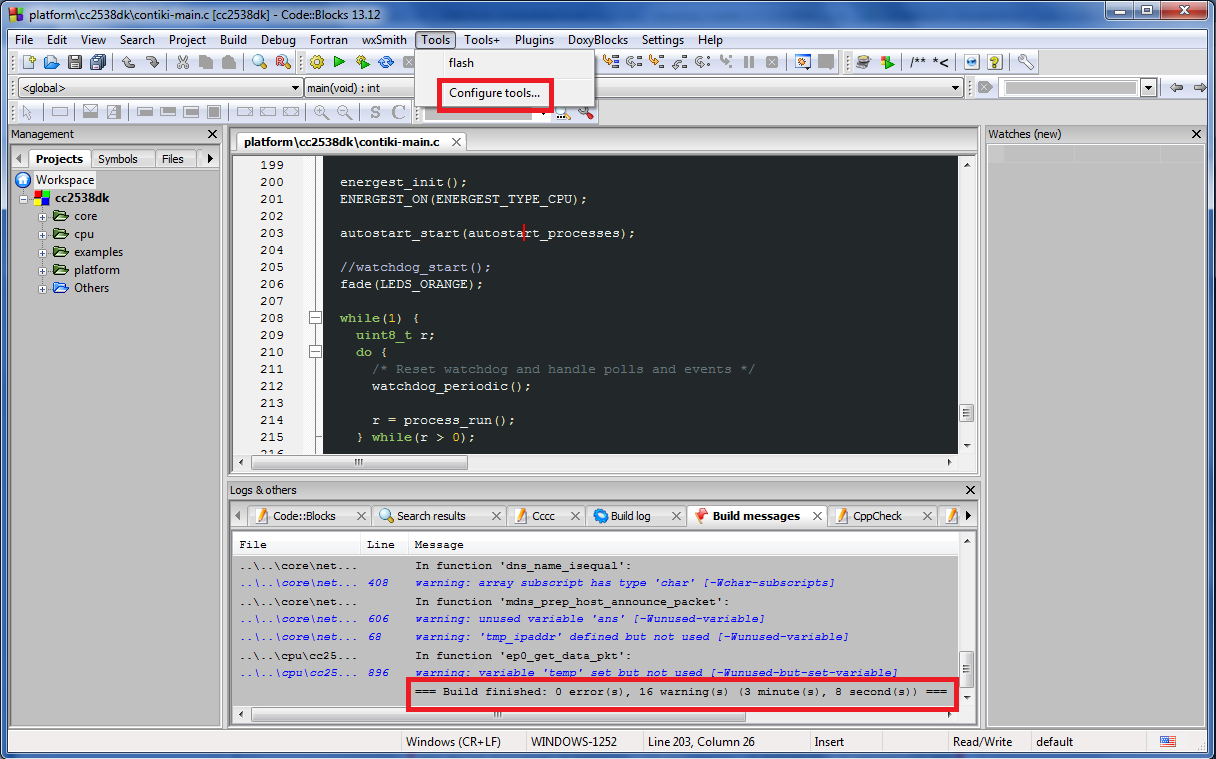
As described in the AN128 application note, it is possible to flash the code using internal IDE command tool. To do this go to “Tools” -> “Configure tools…” as shown in the screenshot above. By doing this, it will pop up a new window called “User-defined tools”, then do the following steps to configure the flash tool:
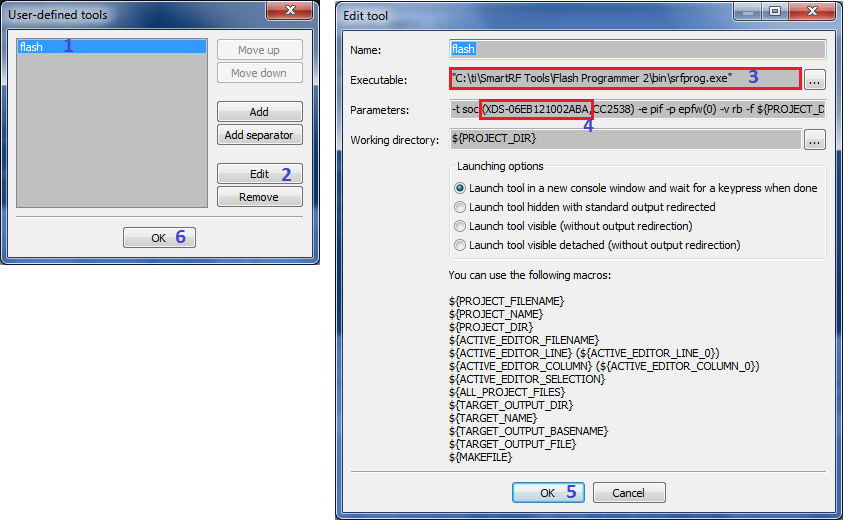
In the “User-defined tools”, click on the “flash” tool name (1) and then click the “Edit” button. This will pop up a new window called “Edit tool”. Make sure that the executable path points to the command line executable of SmartRF Flash Programmer 2 (if you haven’t installed SmartRF Flash Programmer 2, you can download it from this link). Then as described in AN128 chapter 5.3, change the ID of the XDS100v3 debugger on your SmartRF06EB board (4).
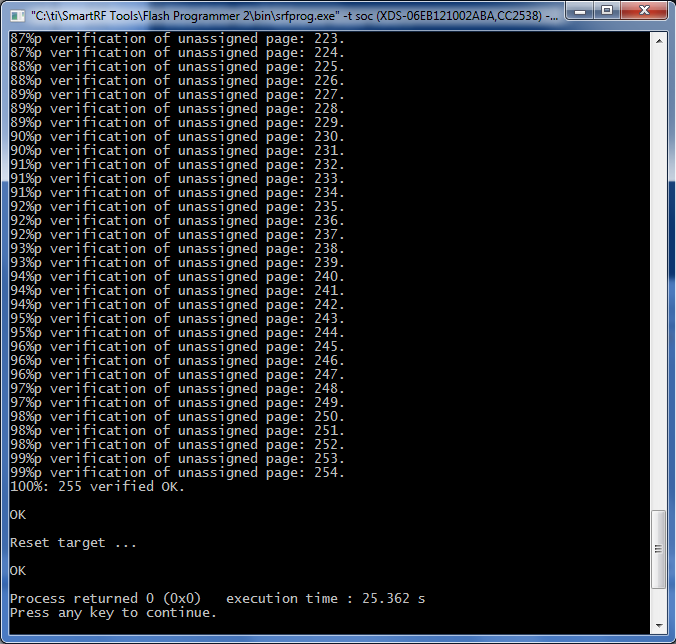
Click OK button at “Edit tool” window (5) to go back to “User-defined tools” and click then click OK button also on the “User defined tools” windows to go back to the main Code::Blocks IDE window. Now connect the CC2538DK via USB to the PC, and execute the flash tool by going “Tools” -> “flash”. If everything goes right, it shall open a new command line window and show the programming process output as follows:
Setting Up GDB Server/Agent
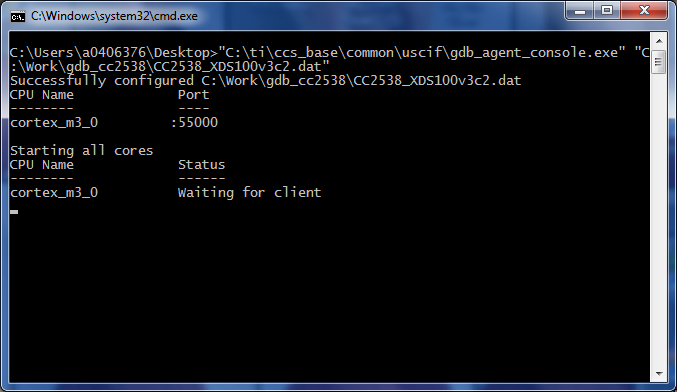
After flashing the binary to the CC2538DK, it is now time to run the GDB server/agent as described AN128 application note chapter 5.5. The installer of TI GDB server/agent can be downloaded from this link. It comes in two flavors: a GUI executable (gdb_agent_gui.exe) and a command line executable (gdb_agent_console.exe). I personally like the command line more since it is easier for me to execute it. I make a simple gdb_agent.bat file on my desktop and fill it with this one line simple command:
"C:\ti\ccs_base\common\uscif\gdb_agent_console.exe" "C:\Work\gdb_cc2538\CC2538_XDS100v3c2.dat"
The GUI server/agent needs a parameter for the board datafile. I am using the CC2538_XDS100v3c2.dat which can be downloaded from the AN128 associated files. After executing the gdb_agent.bat, I can see the following windows appear showing that the GDB server/agent is working:
Launch Debug Session
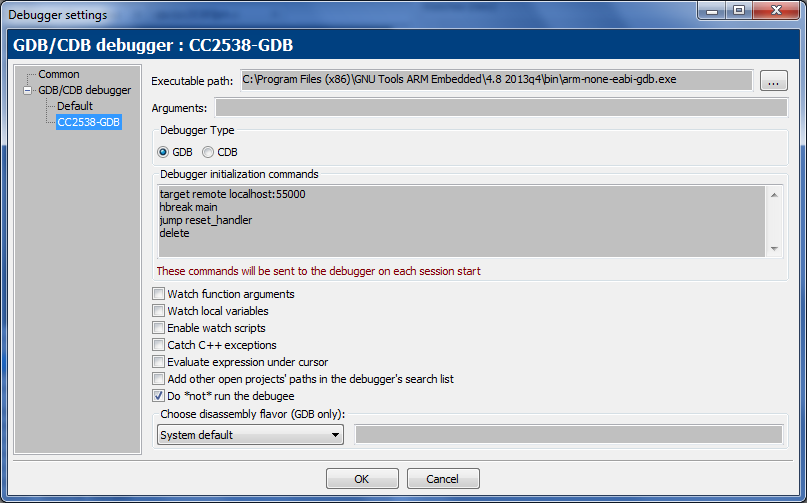
Now as the TI GDB Agent/Server is running, we are ready to start the debugging. First make sure that the debugger setting is correct. Go to “Settings” -> “Debugger” and check whether the “Executable path” of the CC2538-GDB setting is pointing to the installed GDB binary and also the “Do *not* run debugee” box is unchecked as follows:
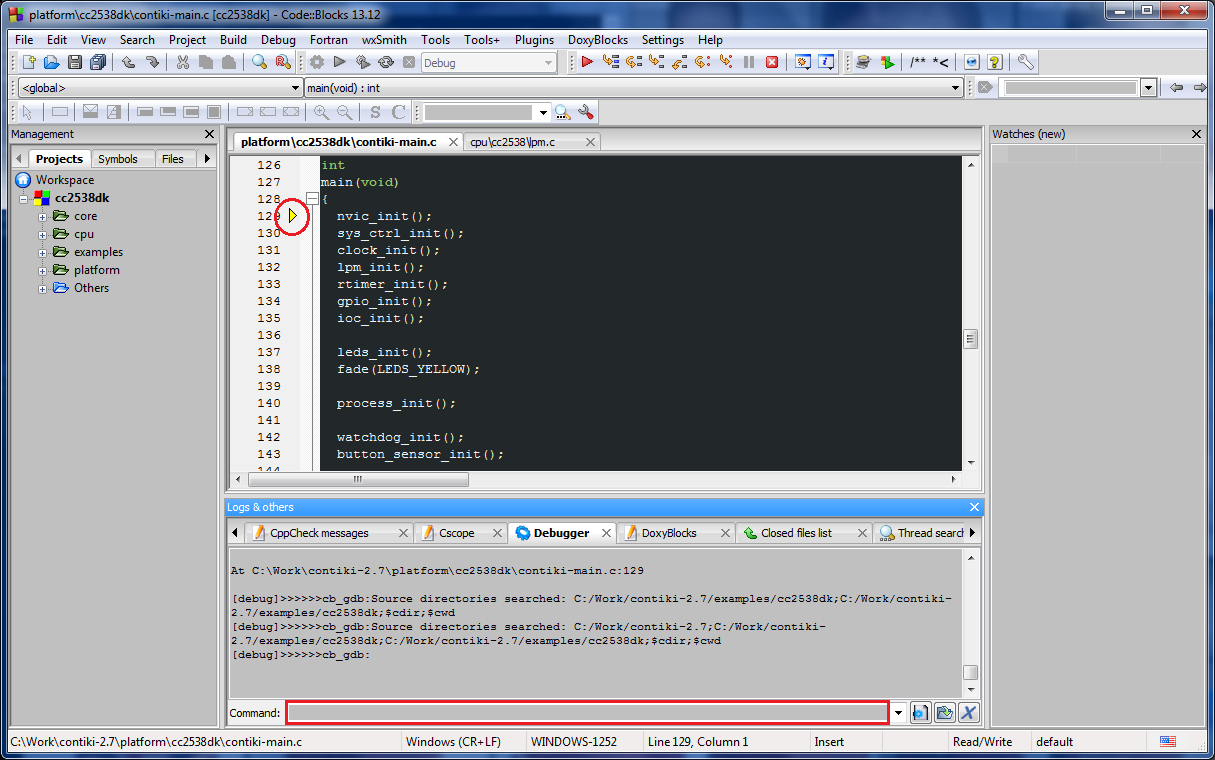
Now, launch the debugging session by going to “Debug” -> “Start/Continue” (or by pressing F8). You need to wait around 10-20 seconds for getting the connection between the IDE debugger and the GDB agent/server established. Once it is connected, you can find that in the editor section of the Code::Blocks IDE, a small arrow appears at the beginning of main() function and the “Command” text field under the “Debugger” sub-window is now writable.
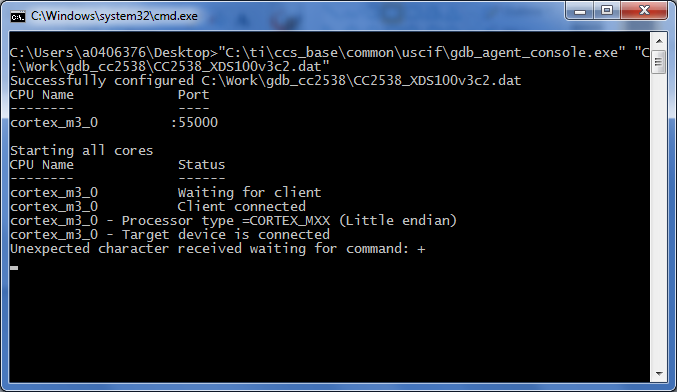
On the other hand, the GDB server/agent window also shows some output indicating that a connection with a the target has been established
Now as the debugging session has been started, we can start do debugging.
Basic Debugging with GDB
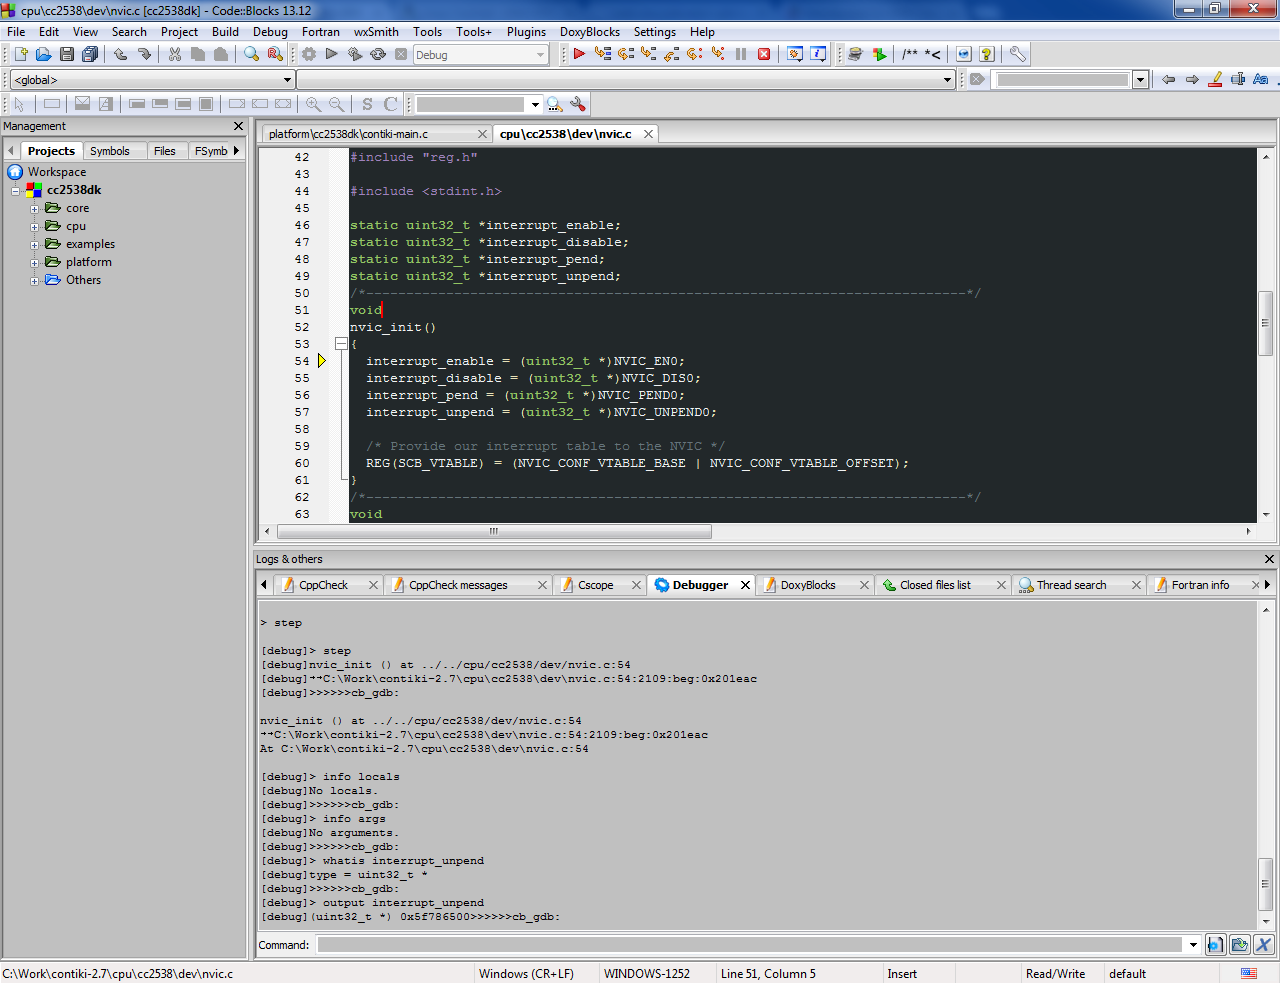
Since we are using GDB, basically debugging can be done by typing GDB commands to the Command text field of the Code::Blocks IDE. Users can just type in the GDB command in the Command text field and press enter to send the command to the target. The following screenshot shows for example how the command “step” is executed by the GDB right after reset resulting the code goes into the first function in the main() code which which is the nvic_init() function:
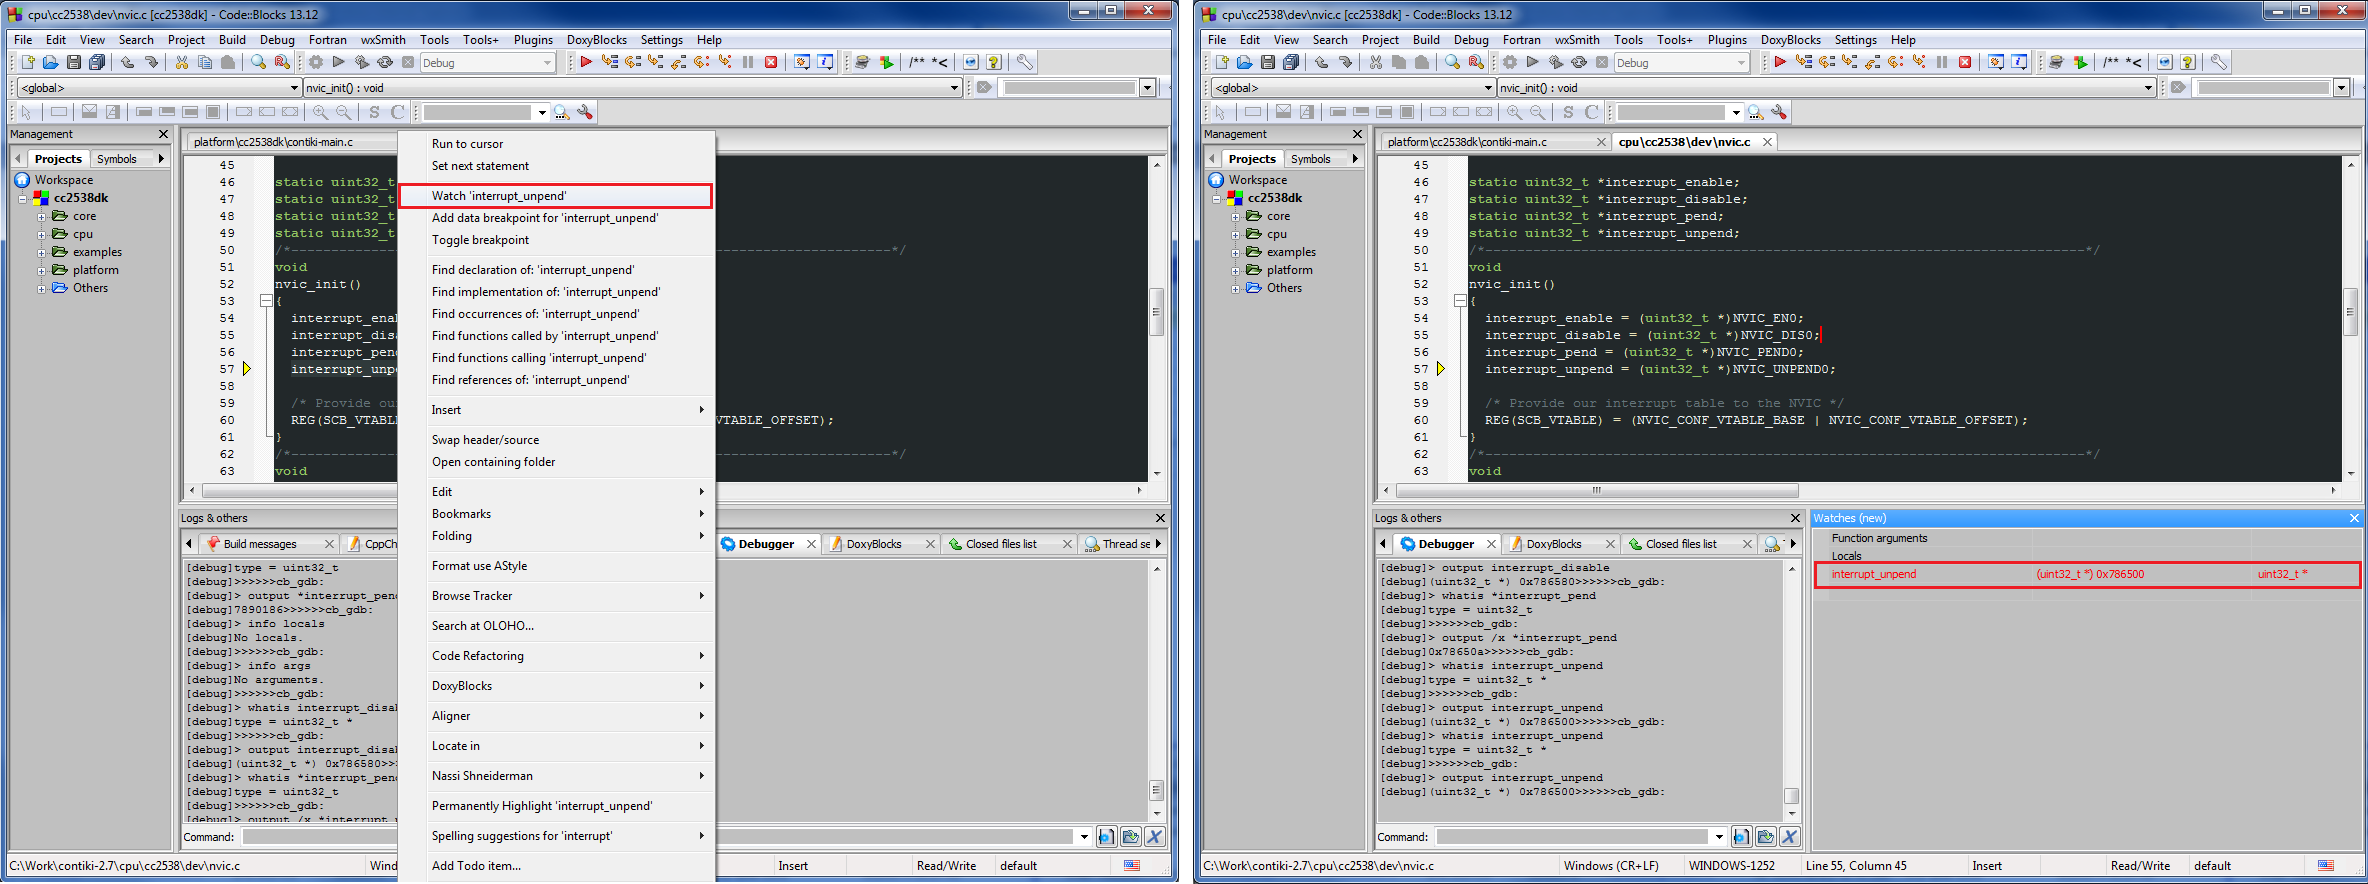
However it is also possible use some of the debugging interface of the Code::Blocks IDE (can be found under “Debug”). For example basic debugging capability for watching variable values works quite good even by using the User Interface of the Code::Blocks IDE (right click on variable name, then click “Watch ‘variable_name'”) as shown in the following screenshots.
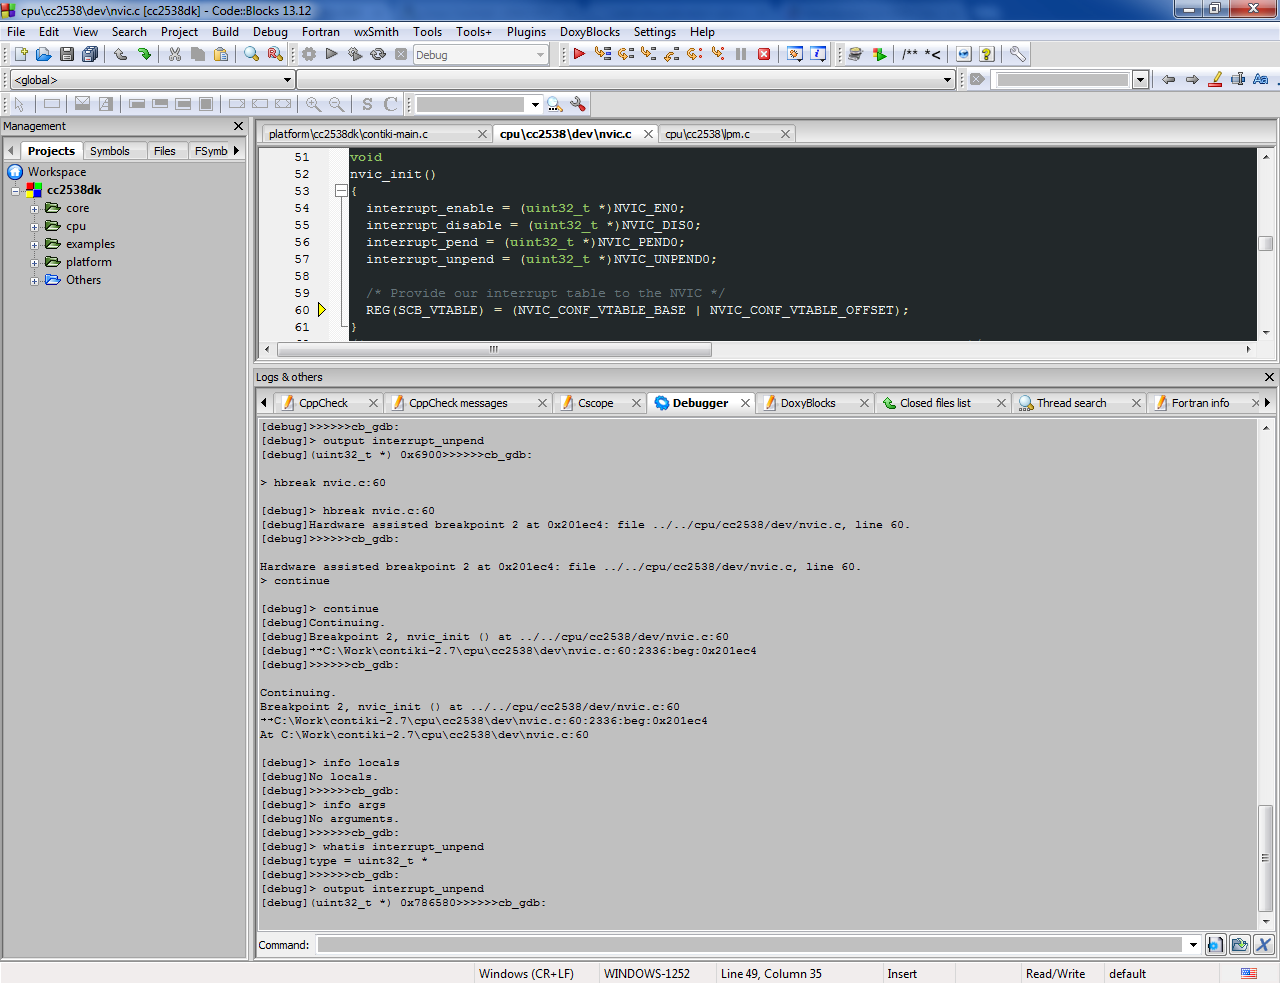
Setting breakpoint is however a bit more complicated. The GDB command “hbreak” (hardware breakpoint) shall be used to set breakpoint on CC2538 instead of the normal “break” command. However it seems that per default, the Code::Blocks will only use “break” command to set breakpoint when it is set via the user interface (e.g. via right click in the source window, then click “Toggle breakpoint”). The following screenshot shows an example on how to set a breakpoint using ‘hbreak’ command followed by ‘continue’ command to test whether the breakpoint works.
Another side effect of the breakpoint problem is that it is not possible to do “Step out”/”Step over” debugging for bypassing a function call, since basically would require to set a breakpoint and Code::Blocks seems always to use ‘break’ instead of ‘hbreak’ commands for this purpose. When trying to look for more information about this issue, I found out that basically the usage of ‘break’ command for setting breakpoint seems to be hard-coded in Code::Blocks during compilation, so it is also possible to change the IDE source code and recompile it.
Hello, thanks for sharing!
Could you please also share the global compiler settings?
I just saw your previous post, I should have started from there, thanks!
Hello my dear friend! At first, I’d like to say that I appreciate your tutorial…
I’m having a little trouble, when I press F8 this message appears : Error : SETUP_PARSER.dll is missing. Do you know where I can get this dll?
Thanks!!!